A Gantt Chart, or Gantt Diagram, provides a timeline for a project giving an overview of how a project is progressing. Project activities, tasks and events are easy to see relative to one another, and the gantt chart allows multiple users to see how the project is progressing over time and what steps or tasks are next.
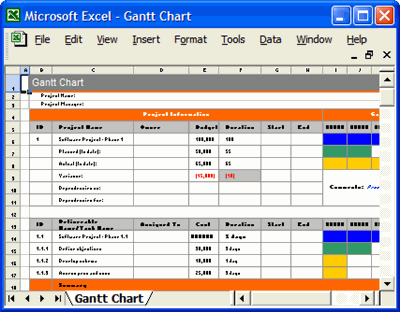
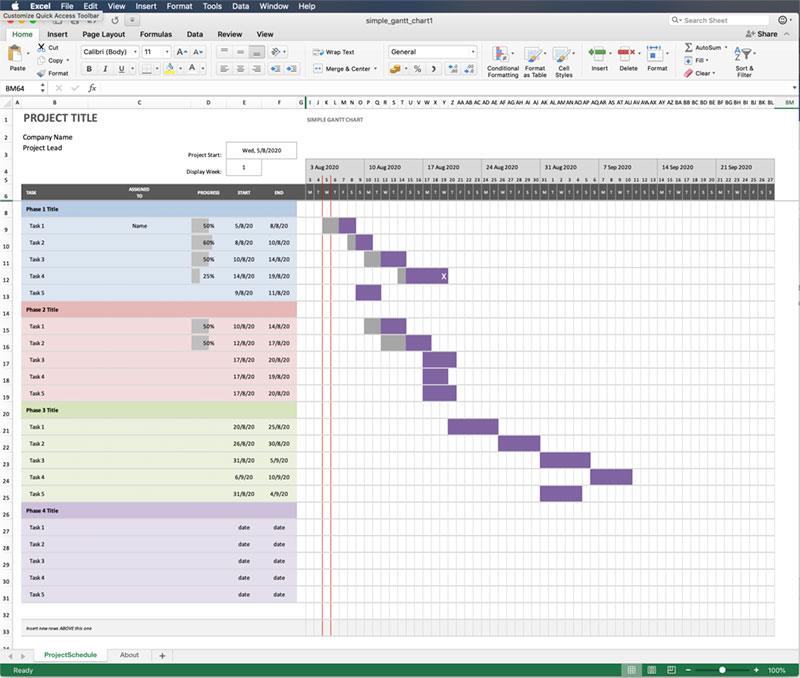
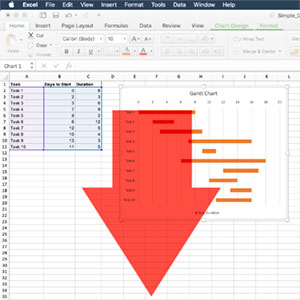
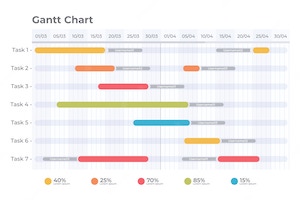
A Gantt Chart is used for planning, scheduling and monitoring projects, and managing the dependencies between project tasks. Below is a simple Gantt Chart layout showing tasks, dates and duration. As the chart becomes filled with more project tasks the timescale will increase and the way in which each activity relates to the overall project progression will be seen.

The Gantt Chart will have a list of tasks on the left, in the order they will be started. There will start and end dates for each task, with the duration marked on the calendar bar so that it shows the relationship to all other tasks. Some tasks will overlap with others, and some will only be able to start when the previous task has been completed. With Gantt Chart software the start and end dates can be changed as the project progresses, to reflect delays or work completed early. Related tasks can then be adjusted in relation to the new schedule. Different colours can be used to denote interrelated tasks, primary and secondary tasks, and critical activities.
The first concept of the Gantt Chart was devised by a Polish engineer called Karol Adamiecki at a steelworks around 1896. Henry Gantt, an American mechanical engineer and management consultant, took these ideas and developed his own scheduling tools that have taken his name around 1910-15. Gantt charts are now "one of the most widely used management tools for project scheduling and control".
An example of a Gantt Chart can be downloaded here as a pdf.
Gantt Charts: An Essential Tool for Success
Gantt charts have revolutionized the field of project management and planning, providing a visual and easily digestible representation of a project's timeline, tasks, and milestones. In this article, we will explore the intricacies of Gantt charts, their benefits, and how to effectively use them in managing projects.
What is a Gantt Chart?
A Gantt chart is a visual representation of a project's schedule, illustrating tasks, durations, dependencies, and milestones. It displays tasks horizontally as bars, with their start and end dates plotted on a vertical calendar-like timeline. The length of each bar represents the duration of the task, and tasks can be organized into groups, making it easy to track progress and identify potential bottlenecks or delays.
The History of Gantt Charts
Gantt charts were invented by Henry L. Gantt in 1910, an American mechanical engineer, and management consultant. Initially, Gantt charts were drawn on paper, and updating them was a labor-intensive process. With the advent of computers and project management software, Gantt charts have become a powerful tool for project managers to efficiently plan, monitor, and control projects.
Advantages of Gantt Charts in Project Management
Gantt charts offer numerous benefits to project managers, including:
- Improved Communication: They serve as an effective communication tool, allowing team members to quickly grasp the project's scope, deadlines, and dependencies.
- Resource Management: Gantt charts help project managers allocate resources efficiently and identify potential bottlenecks.
- Progress Tracking: By comparing planned progress with actual progress, project managers can identify delays and adjust the schedule accordingly.
- Clear Visualization: Gantt charts provide a clear, visual representation of the project timeline, allowing stakeholders to understand the project's status at a glance.
Components of a Gantt Chart
A typical Gantt chart consists of the following components:
- Tasks: A list of activities that need to be completed during the project.
- Task Durations: The estimated time it takes to complete each task.
- Start and End Dates: The planned start and end dates for each task.
- Dependencies: Relationships between tasks, showing which tasks must be completed before others can begin.
- Milestones: Significant events or achievements in the project that mark progress.
- Resources: The team members, equipment, and materials required for each task.
How to Create a Gantt Chart
Creating a Gantt chart involves the following steps:
- Define project goals and objectives.
- Break down the project into smaller, manageable tasks.
- Estimate the duration for each task.
- Determine dependencies between tasks.
- Assign resources to tasks.
- Establish milestones.
- Plot the tasks, durations, and dependencies on a timeline.
Gantt Chart Software and Tools
Today, a variety of software and tools are available to help create and manage Gantt charts, including Microsoft Project, Smartsheet, Asana, and Trello. These tools offer features like real-time collaboration, automatic updates, and integration with other project management tools, making it easier than ever to use Gantt charts effectively.
Tips for Effective Gantt Chart Implementation
- Keep it Simple: Avoid overloading the Gantt chart with excessive detail. Focus on the most important tasks and milestones to maintain clarity and readability.
- Regularly Update: Ensure the Gantt chart is up-to-date with the latest progress and changes, enabling effective tracking and decision-making.
- Collaborate with Team Members: Encourage team members to actively engage with the Gantt chart, provide updates, and contribute to its accuracy and effectiveness.
- Use Color Coding: Utilize colors to differentiate tasks, phases, or team members, making it easier to understand the chart at a glance.
- Set Realistic Deadlines: Be realistic when setting task durations and deadlines, taking into account potential risks and uncertainties that could cause delays.
- Monitor Progress: Regularly review the Gantt chart to compare planned progress with actual progress, making adjustments as needed to keep the project on track.
Conclusion
Gantt charts have become an indispensable tool in project management and planning, offering a straightforward and visually appealing way to manage complex projects. By understanding the components of a Gantt chart, utilizing available software and tools, and following best practices, project managers can maximize the effectiveness of Gantt charts in driving project success.
